Clarus Wealth Advisors Market Watch July 13, 2026
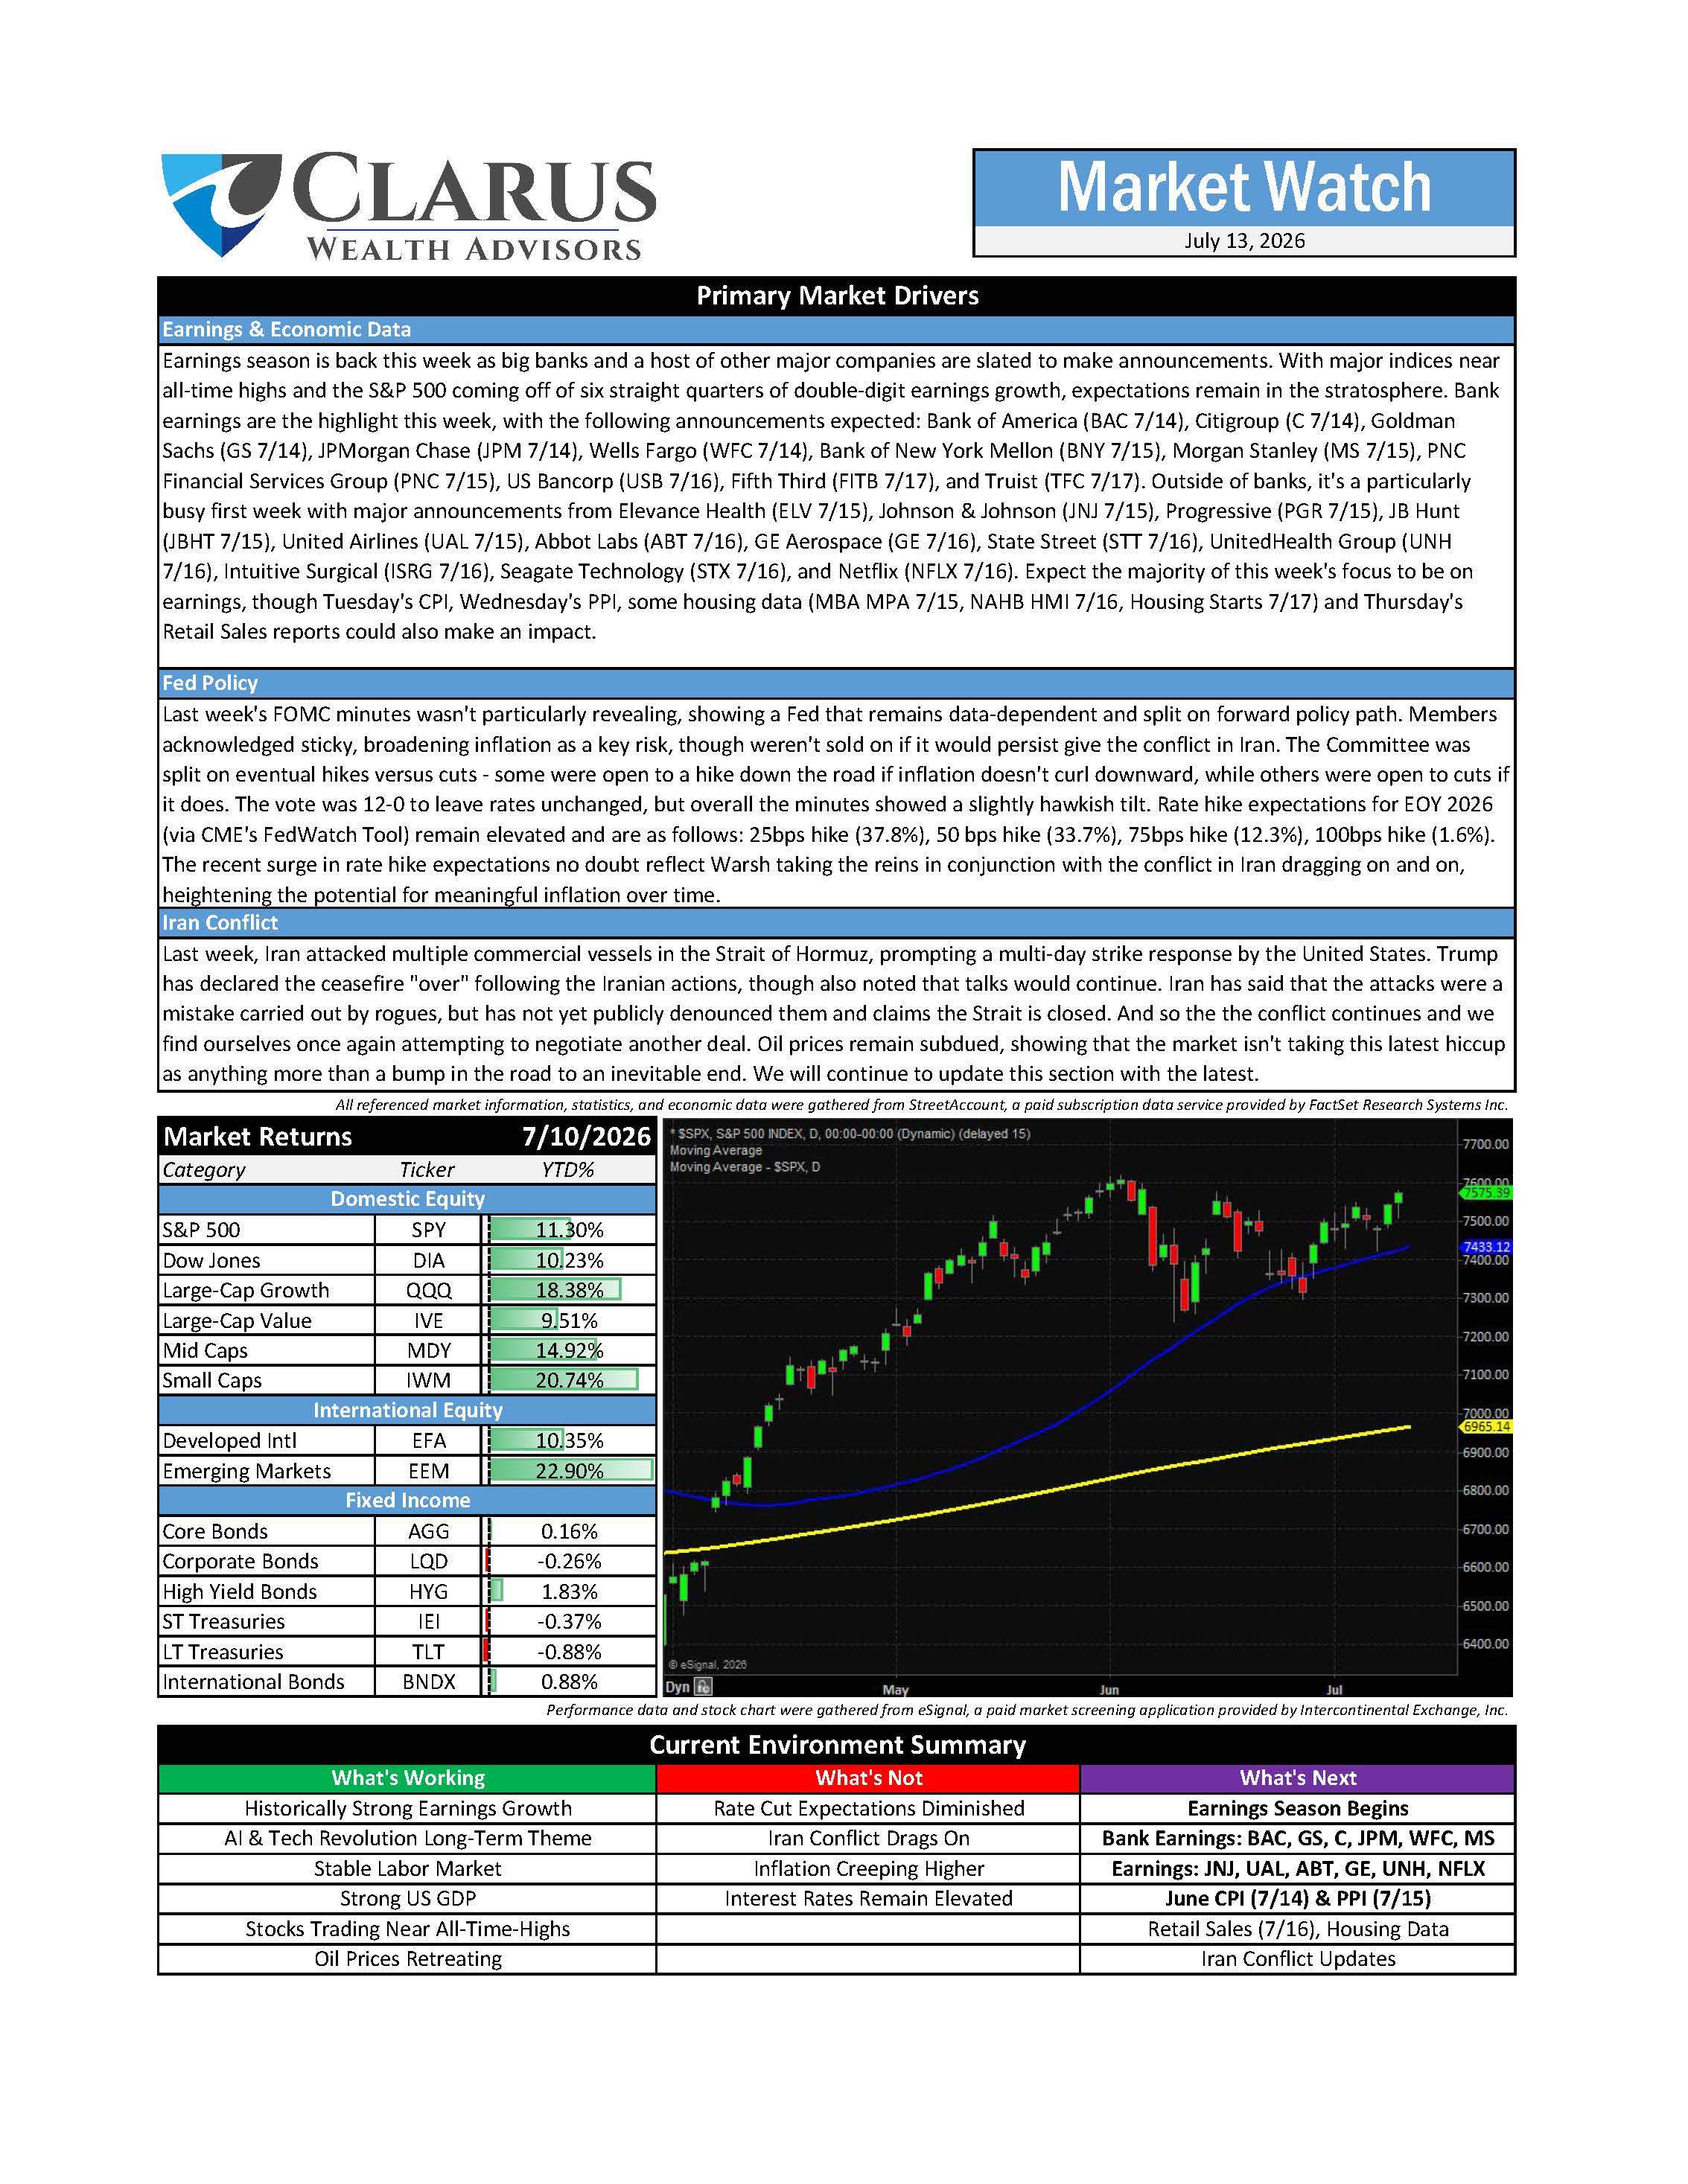
Submitted by Clarus Wealth on July 13th, 2026This week's Market Watch has Don and Ken discussing Earnings Season, sector rotation, Fed Minutes, and more. Enjoy!
![]()
![]()
This week's Market Watch has Don and Ken discussing Earnings Season, sector rotation, Fed Minutes, and more. Enjoy!
Keeping your technology up-to-date, keeping your financial advisor informed of changes to your personal information, using your Wi-Fi hotspot instead of public Wi-Fi, logging out completely from any financial websites, and using two-step authentication are just a handful of the tips that Schwab suggests to prevent fraud. The rest of the list can be found in the attached pdf.
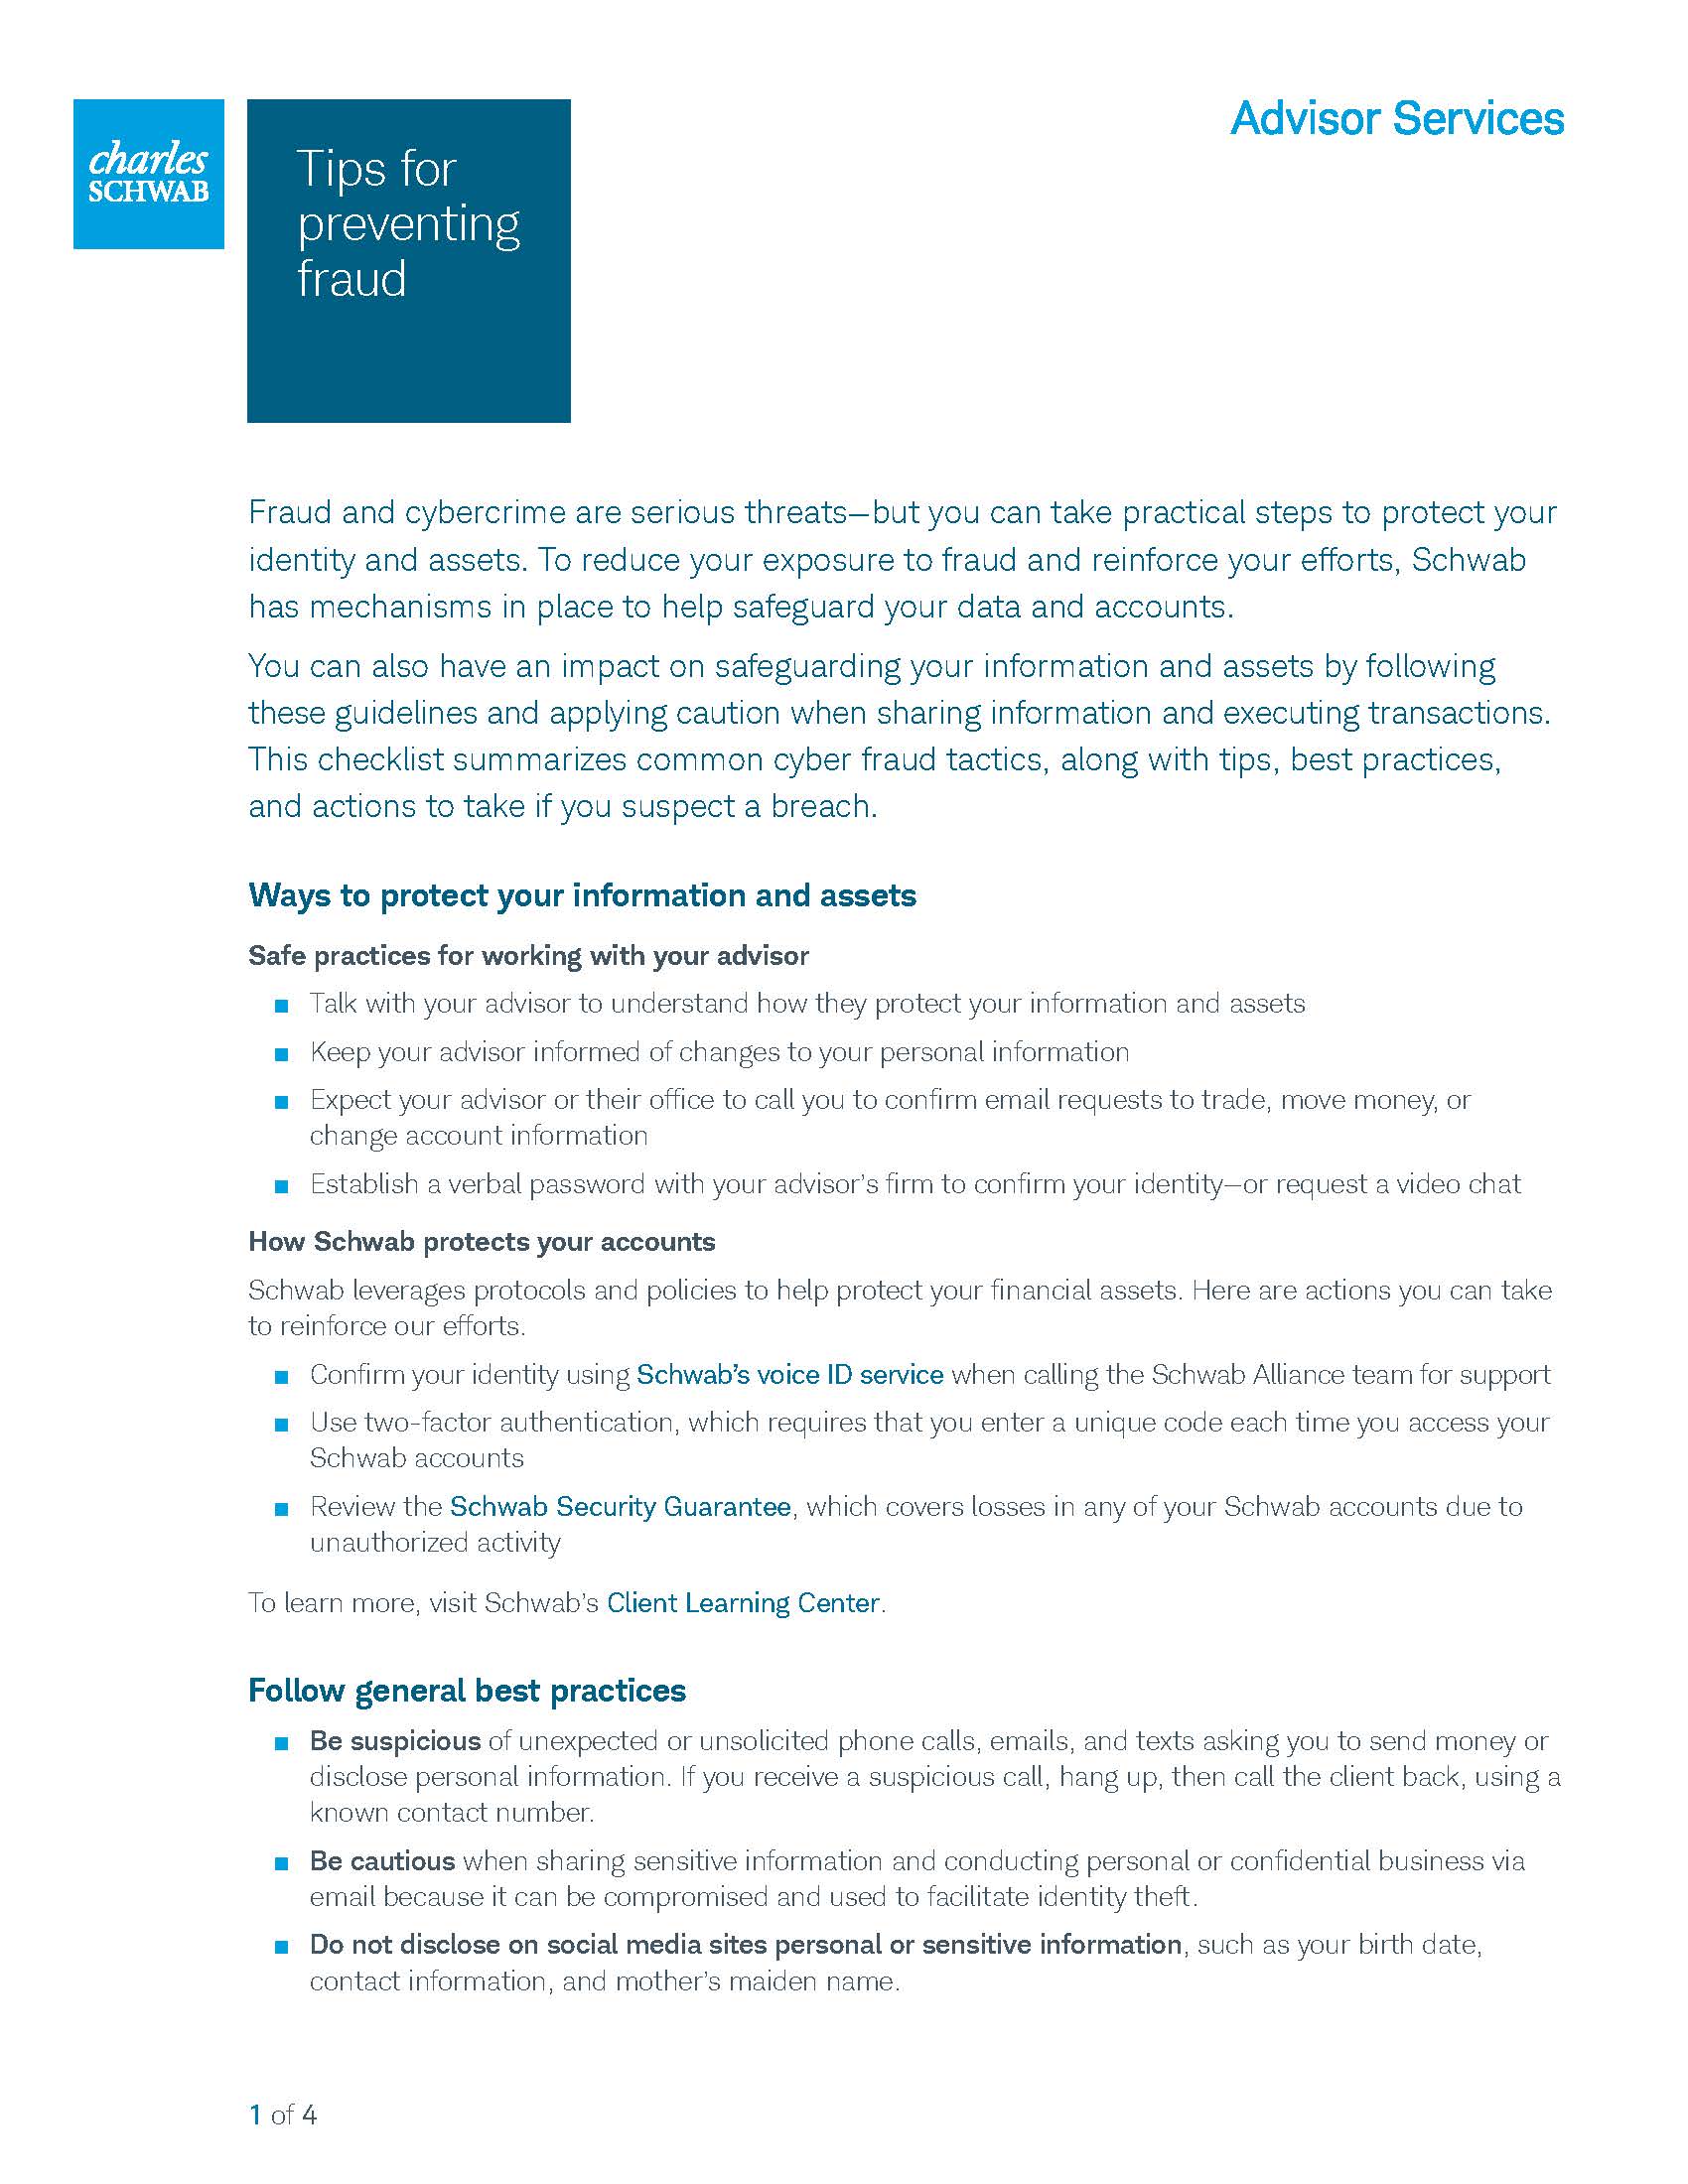
A Financial Professional can help you make and stick to a plan, with the flexibility to adjust it as necessary. This, and other included tips in the attached article, may assist you in avoiding emotional-based financial decisions.

The New York Stock Exchange (NYSE) was officially founded in 1792, the stock ticker was introduced in 1867, and a Chinese gong was the original opening and closing bell, beginning in the 1870s. Computers were added in 1960s, as was the first permanent female member. The first Black member joined in 1970, and the first day that a billion shares were traded was in 1997. You can read about these dates and more in this article, detailing the history of NYSE.

The One Big Beautiful Bill made changes to tax laws. This linked article from Intuit discusses the changes that may impact teachers, employers, parents, and more.
Kevin Warsh held his first press conference last week and Alan Greenspan passed away yesterday at the age of 100. Our Portfolio Managers discuss these two Fed Chairs and more, in this week's Market Watch.
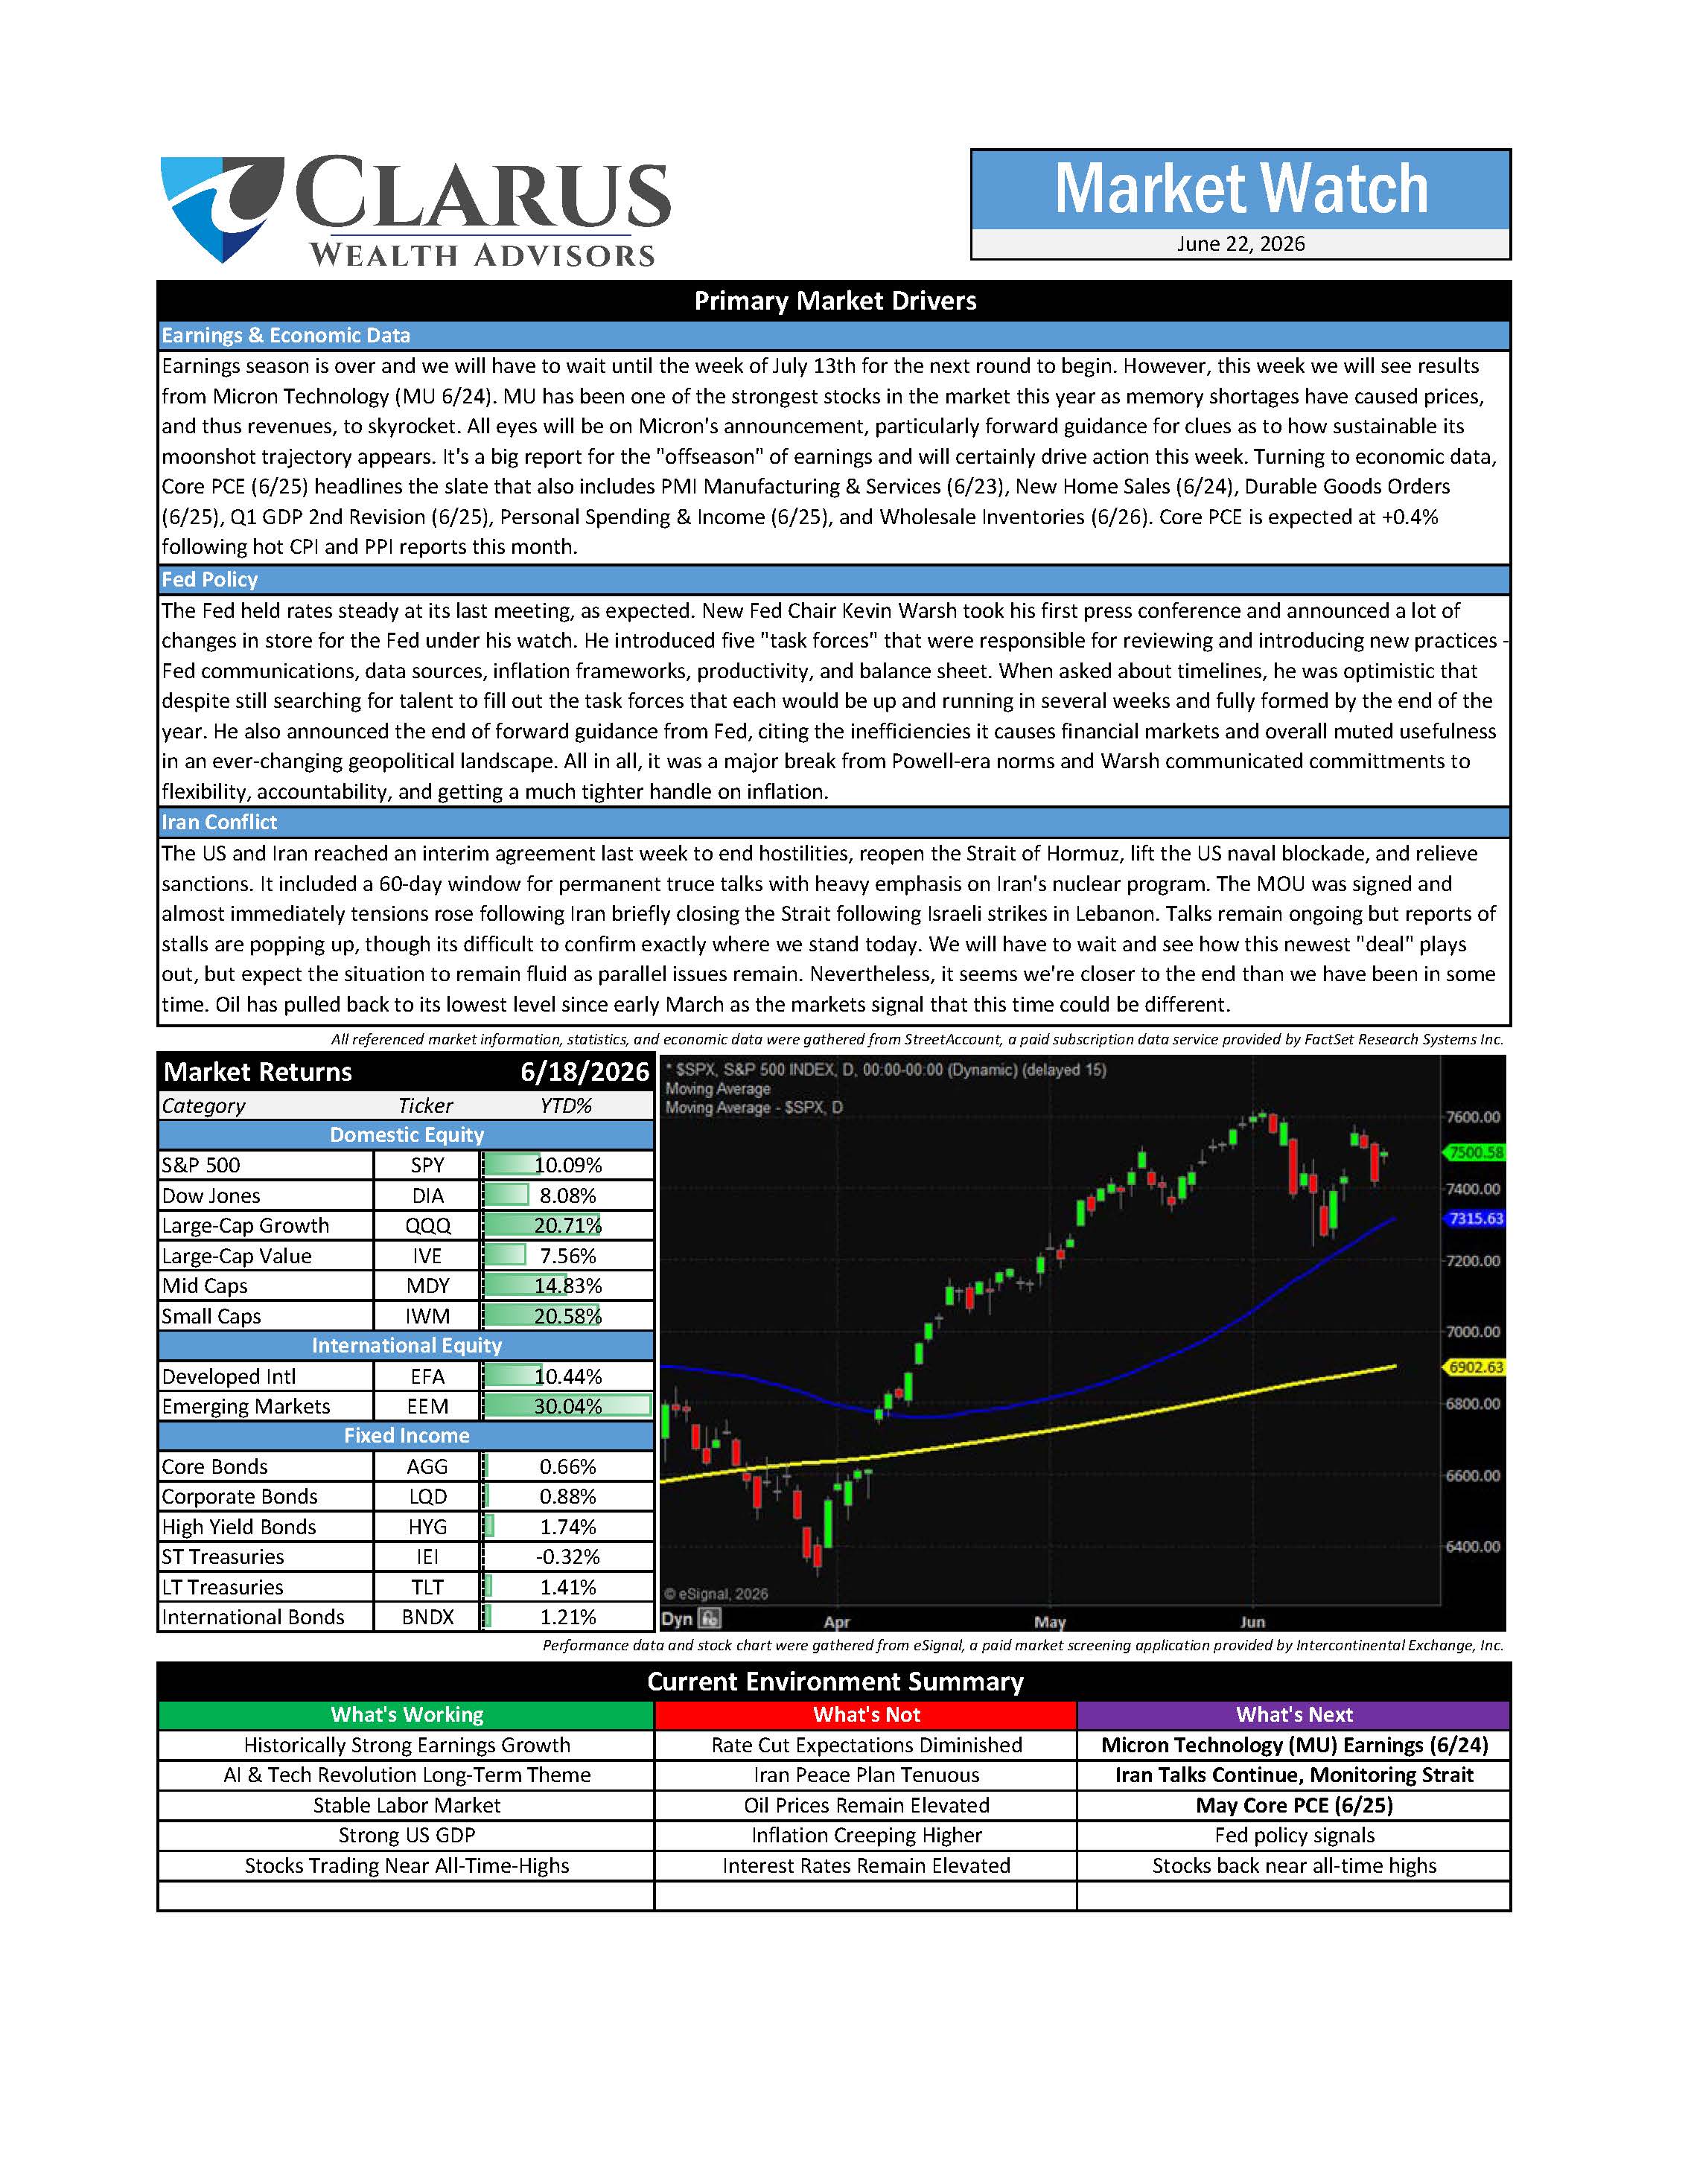
Earnings season has wrapped up, for now. Don and Ken discuss this, the probability of a rate change announcement on Wednesday, and the latest on the Iran Conflict, in this week's Market Watch.
In this week's edition of the Clarus Wealth Advisors Market Watch, Don and Ken discuss how oil prices and inflation have moved higher as the Iran conflict has continued, the "G" economy, a possible rebound in some software prices, and more.
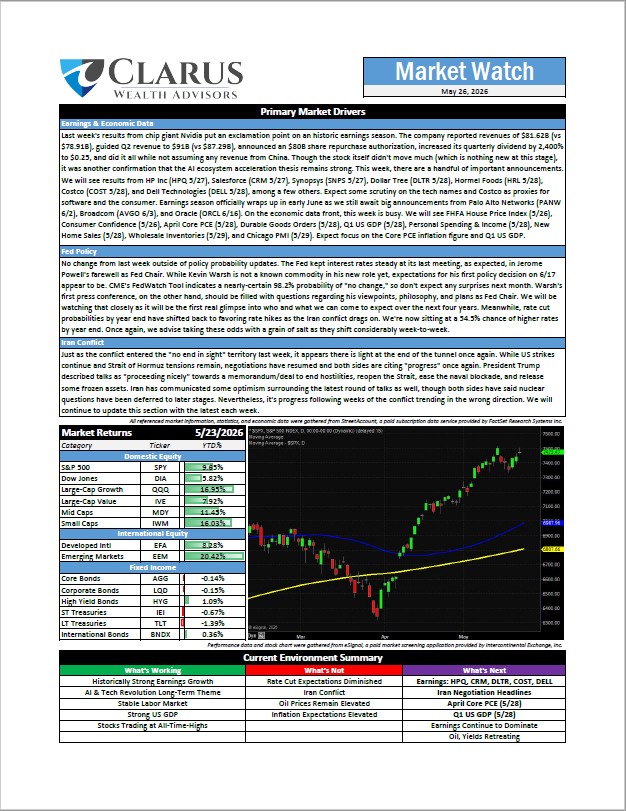
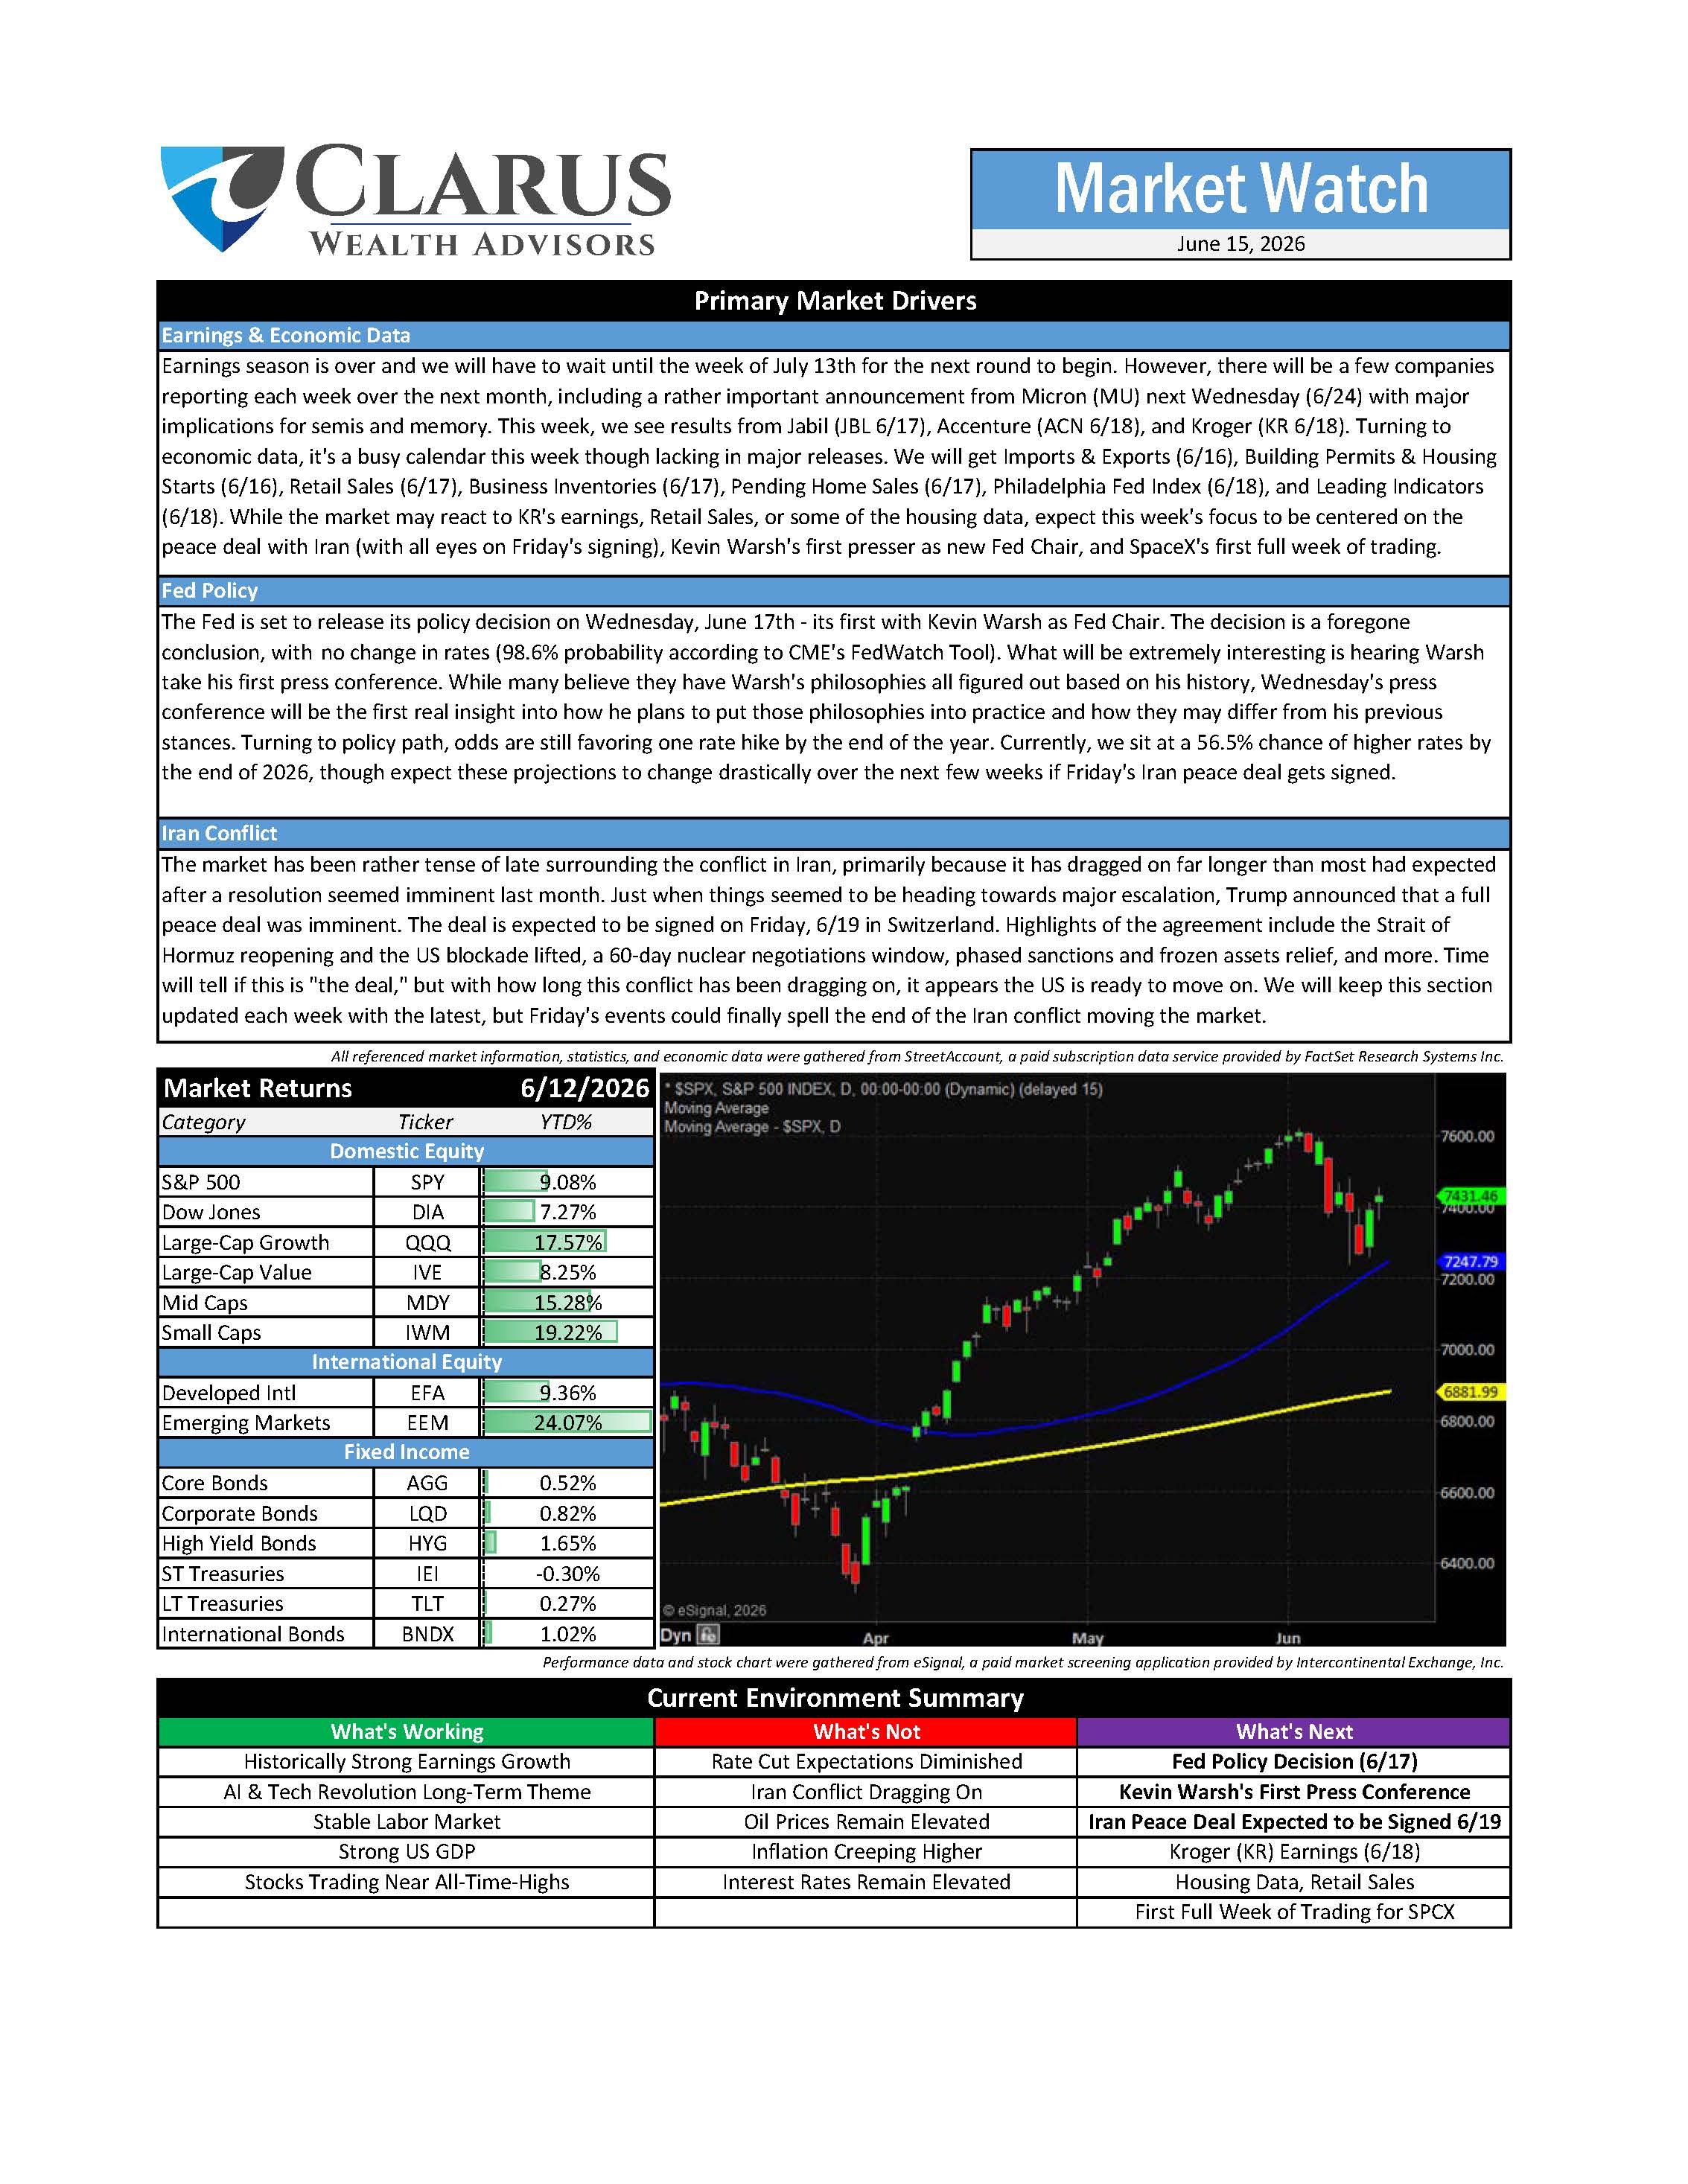
Kevin Warsh is officially the Fed Chair and his first press conference is upcoming. There is possible progress with the Iran Conflict. Costco, Dell, Hormel Foods and others are expected to release their earnings this week. Read more in this week's Clarus Market Watch.
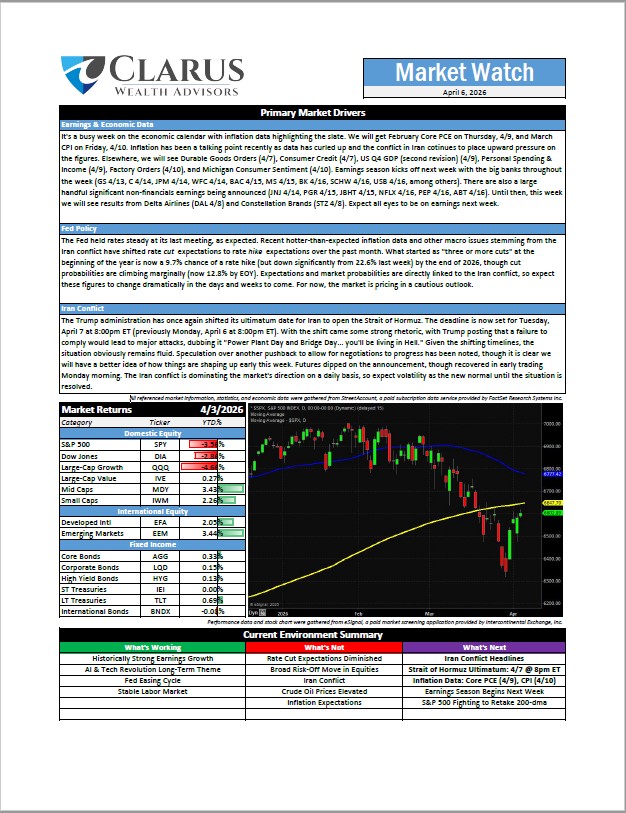
This week's Market Watch includes dates for inflation data, 4th Quarter 2025 GDP, and more.
© 2026 Clarus Wealth . All rights reserved.